How to use MTR – A Guide For Windows, Mac, and Linux
One of the most important aspects of an internet connected system is the stability of the network. There are a number of tools to diagnose, troubleshoot, and verify network performance and connectivity. Today we’re going to be discussing one of the most important of those: MTR.

In this article, we will address some important topics:
- What is an MTR?
- Why would you use MTR?
- How does MTR differ from a traceroute?
- Tips for running an MTR test
- How to install and run MTR on Windows, Mac, and Linux
- Sharing MTR details with your dedicated hosting provider
Table of Contents
What is an MTR?
MTR or MyTraceRoute is one of the most popular diagnostic resources available at the moment. It has replaced the standard Traceroute as a go-to tool, mainly used to poll remote servers with a hop-by-hop analysis similar to a standard traceroute. Once polled, an MTR reports the quality of connections in the format of a table. To summarize, the MTR diagnostic tool is mainly used to assist in identifying where internet connections are failing, and in the process, help identify what is causing network performance to suffer.
How does MTR differ from a traceroute?
A standard traceroute is primarily used to understand the routing within a network. Both MTR and traceroute calculates the route a packet takes and shows the user the amount of time taken for the packet to traverse each hop. Both tools help you understand if a packet is taking a sub-optimal path to reach its destination, such as, going from Hong Kong to Los Angeles to Singapore, instead of directly from Hong Kong to Singapore. The main difference from a traceroute is that MTR tests each hop many times, whereas a traceroute by default only tests each hop 3 times.
Because an MTR tests each hop many times, it is possible to identify the source of small amounts of packet loss. Packet loss as low as 0.2% can cause performance problems, and so testing a link using an MTR with 1,000 or more iterations is necessary to find this small amount of packet loss. As a result, MTR can be used to determine if there is packet loss on a particular route, and which network hop that packet loss begins. This allows MTR to provide a more in-depth report of the connection quality than a standard traceroute.
Why would you use an MTR?
From an end user perspective, the biggest reason to use an MTR, is that without the MTR results, their hosting provider has no ability to determine if there is a network problem and no ability to solve it. A generic complaint of “the network is not good” does nothing to help narrow down which router is having a problem and therefore provides no ability to route around the problem network hop.
By knowing the hop where packet loss begins, a network operator can adjust their routing to avoid the troublesome network hop. As well, this allows them to bring the issue to the attention of the network in question, asking them to fix the problem.
Tips On Running an MTR
To get useful MTR results, follow these important tips:
- Run the MTR test in both directions (from the client to the server, and from the server to the client)
- Run 1,000 or more counts / iterations
- Run MTR with the –no-dns option enabled
- The interval (time between iterations) should be 0.5 seconds or slower.
Run the MTR test in “both directions”:
A network problem does not exist for all parts of the internet at once. Typically, performance may suffer between one source and one destination without impacting other destinations. Therefore, if an end user is having trouble reaching your network, it is critical to know the IP address of that end user. We will call that the “local IP”. If you do not know your local IP, you can find it from an IP website such as whatismyip.com. It is also critical to know the IP address of the server that is having problems. We will call the server IP the “target” IP.
Once you know your local IP and the target IP, it is necessary to run MTR in “both directions” to best identify the source of any network issues. This means the end user will run MTR using the “target IP” (server IP) to run a test from their own computer. And then after that, you will run an MTR test from the server while testing against the end user’s “local IP”.
We do this because internet traffic doesn’t always take the same path in both directions. By running the test in both directions, you can more easily determine all of the routers involved in a connection, and find the router hop that is having problems. Based on the available providers and carriers, the initial path could have no issues, while the return path may be experiencing latency.
Run 1,000 or more counts / iterations:
As mentioned previously, packet loss as low as 0.2% may cause performance issues. In order to reliably identify this small amount of packet loss, we recommend running an MTR with 1,000 “counts” (tests). Running fewer than 1,000 counts, you are unlikely to find out which hop where this packet loss begins, and you may not detect any packet loss at all. For example, with only 100 counts, there is only a 20% chance of detecting -any- packet loss when a router hop has 0.2% packet loss.
Run MTR with the –no-dns option enabled
By default, MTR will convert the IP address of each hop into a DNS name by performing a “reverse DNS” lookup. This can be convenient when a network provider has chosen a useful reverse DNS name for their router, such as “core1.LosAngeles.bigISP.net”, which would let you know that this particular hop probably occurs in Los Angeles and the router is owned by bigISP.net.
As convenient as this can be, unfortunately, the reverse is not always true — the name listed may not have a “forward DNS” entry set that corresponds to the router IP. In this way, resolving the DNS for each hop will strip out useful information about the IP address of each router hop. Running the MTR test with the “no-dns” option, allows the IP addresses of each hop to remain in the output. The network administrator who is evaluating the MTR results can always look up any suspicious IP addresses themselves, which is the preferred method.
Set MTR interval to 0.5 seconds or higher
The default MTR interval (time between each test) is 1 second. For the 1,000 iterations we recommend, this can take 16 minutes. So it makes sense to have a shorter interval. However, you don’t want to overdo it. Each test you run requires every router along the path to receive your inquiry, process it, and reply. To avoid being taken offline by excessive queries, these routers will start to ignore queries that show up too quickly. A good middle ground here is to run each iteration with a 0.5 second interval. This cuts the time in half to run the MTR. At the same time, it is slow enough that routers will not ignore your MTR queries.
How to Perform an MTR On Windows
Step 1: Download WinMTR
The safest place to download the latest version of WinMTR is through the GitHub page.
This can be found by clicking on this link
Once you have navigated to the page, you will want to download the file that ends in ‘static’.
In the case that they provide updates for the tool, the static file will always be the one you want to download

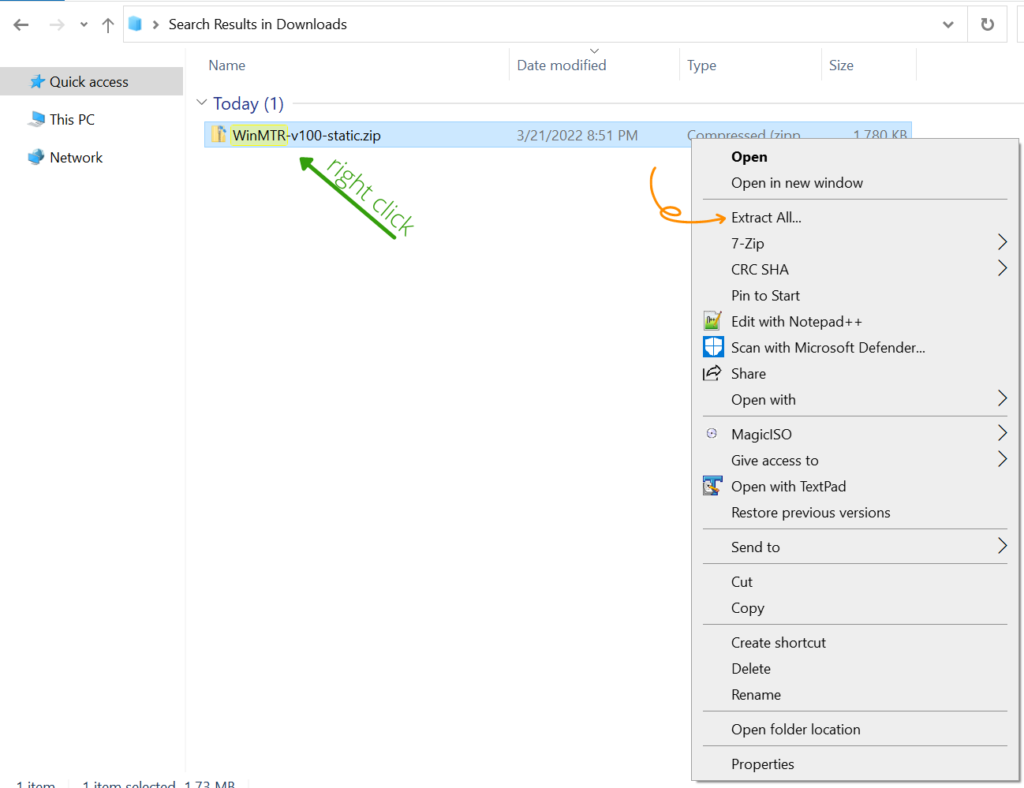
Once the file has been downloaded, the next step is to navigate to the folder it was downloaded to. Once found, unzip the file. We can do this by right clicking the file and selecting “Extract”

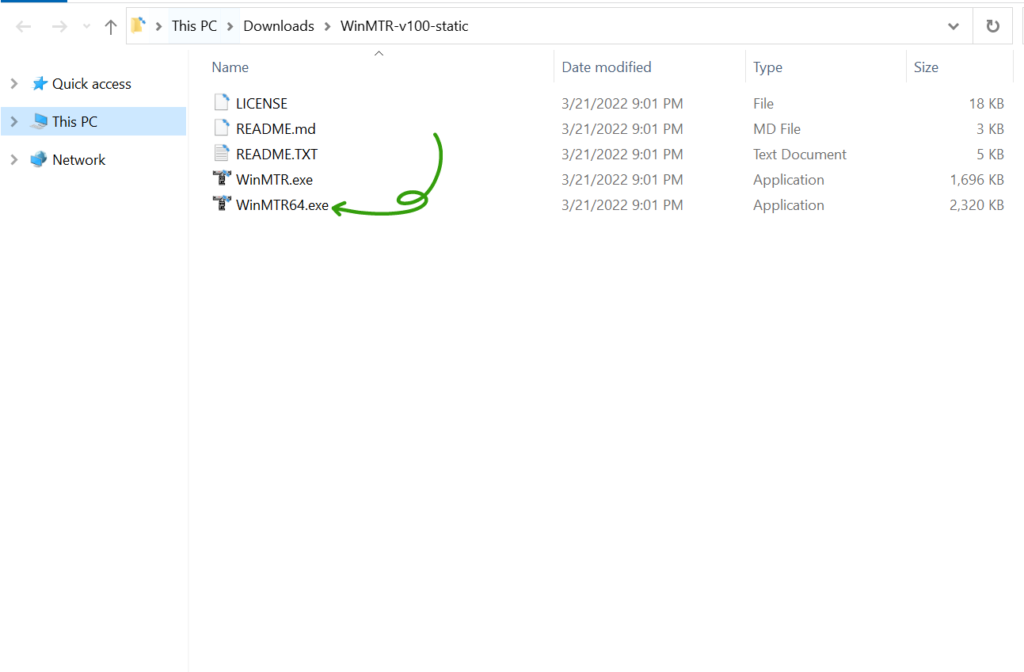
Once the file has been extracted, a new window containing all the extracted files will open.
Double click “WinMTR64.exe” to open the application.
___________________
Step 2: Preparing the MTR Test
Before starting the test we want to open the “options” box to change some settings. We want to make sure the “resolve names” box is not checked.
In the MTR results, it is preferable to see the IP address used in a hop, rather than a random domain name.

Step 3: Starting the MTR Test
In order to start a test we must first enter a domain name or IP address in the host box, then click start.

Step 4: Running the MTR Test
Ideally, we want the test to have at least 1,000 counts, as seen below, to receive the most detailed data as possible.
It should take around 10-15 minutes in order to reach 1000 counts. Once that time has passed, click Stop

Step 5: Exporting the MTR Test
Once the test is finished, you will need to send a copy of the report to our networking team. In order to prepare a copy, you can click “Export TEXT”. Click the option, name and then save the file.

Excellent! At this point you have successfully created an MTR Report on Windows, exported it as a TXT file, and can send the info to our networking technicians.
How to Perform an MTR On Mac
During the process on Mac, some commands require root privileges to run properly. You may see a prompt like the picture below.

If this is the case, typing ‘sudo’ before any command will allow it to run with root privileges. When using ‘sudo’ you will need to supply the user/account password before the command will run.
We are certain that MTR/Homebrew are safe applications, therefore using ‘sudo’ is safe in this situation.
Step 1: Install Homebrew/MTR
In order to run an MTR Test on Mac OS X devices, a package management system will need to be utilized. This system is identified as Homebrew. Homebrew makes libraries and utilities available that aren’t installed by default. As MTR is not available in the apple store or installed by default, we will need to utilize Homebrew.
To install Homebrew, open a terminal window and run the following command:

Once Homebrew is installed, we can install MTR with the following command:

After MTR has been installed, we must change to the local directory with this command:

tip: The MTR version upon making this guide is 0.95, future updates may change the revision number
Once we have changed to the proper directory, we must make the command available to the system by running the following:

[sudo] cp mtr-packet /usr/local/bin/
tip: You may need to copy the ‘mtr-packet’ file available as well
Step 2: Running the MTR Test
Now that we have MTR installed and setup, open a new instance of the terminal and run the following command:

The aforementioned command will start an MTR test with 1000 counts and will not resolve dns names so that we can receive our results in the form of IP addresses. This test will take between 10-15 minutes.
Step 3: Copy the data
Since this command runs in a terminal, you are able to highlight the text, and then right click to copy the text output. You can then paste it into a text file or email to send it to your hosting provider.

Job Done! You have now successfully installed Homebrew/MTR, created an MTR Report, and made a copy of the output on MacOS
How to Perform an MTR On Linux
tip: During the process on Linux, some commands require root privileges to run properly. If you receive an error about permissions, typing the word ‘sudo’ before any command will allow it to run with root privileges. Keep in mind, when using ‘sudo’ you may need to supply the user password before the command will run.
Step1 – Installing MTR
Before running the test, you’ll first need to install the package. The command to do this changes based on your Linux distro.
If you’re running a Red Hat based system, such as CentOS, Fedora, or RHEL, you must run the following command:

If you’re running a Debian based system, like Ubuntu or Debian, you must run the following command:

Step2 – Running the MTR
Once the package has been installed, you can run it by entering the following command:

In the above picture, the “-c 1000” flag tells the MTR to run 1000 counts, allowing us a more detailed output. Additionally, the “–no-dns” flag will tell the test to not resolve dns names, so that the results can be presented in the form of IP addresses.
Step 3 – Share the results
Like Mac OS X, the MTR is done within a terminal and the output can be highlighted and copied. Once copied you can transfer it to a saveable TXT file and / or email it to your hosting provider.

___________________
Quest Complete! By now you should know how to run an MTR and share the results, on Windows, Max, and Linux.
Our team has consistently employed this tool in order to get a visual breakdown of the routes taken by a packet to reach a system or domain.
The MTR tool has been helpful in situations where latency and connection speeds are experiencing issues. It can be utilized on Windows, Mac, and Linux, making it easily accessible. The tests can be combined with custom flags in order to ensure the resulting report is as detailed as possible. The customization, combined with the inherent properties of ping and traceroute make this an invaluable troubleshooting tool and will help ensure that you love hosting your servers with us.
If you love servers like we do, we’d love to work together! IOFLOOD.com offers dedicated servers to people like you, and as part of that service, we utilize many other network tests to ensure stable network performance. To get started today, click here to view our dedicated servers, or email us at sales[at]ioflood.com to ask for a custom quote.


