IOWAIT in Linux — is iowait too high?
High IOWAIT can be a real problem in linux, making your server grind to a halt. The question is, how high is too high? When should I be concerned?
Firstly, we’ll talk about what IOWAIT means, discuss related statistics and how to interpret them, and finally how to decide if IOWAIT is causing a problem.
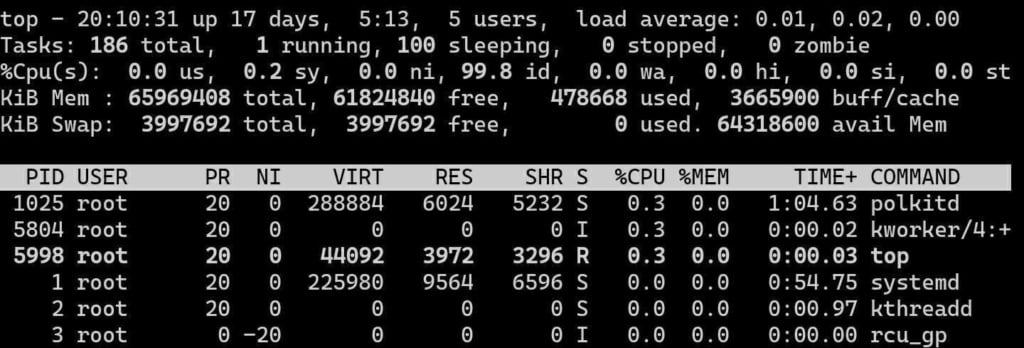
What is IOWAIT? As shown by “wa%” in the command “top”, iowait is the percentage of time that the CPU is waiting for disk accesses before it can do useful work. In the days of single-core single-cpu servers, this percentage was pretty meaningful on its own. A value of 25% meant the system was waiting 1/4th of the time for the disk. Now, with multiple-core servers and hyperthreading, this percentage value doesn’t always mean much. For example, on a Quad Core system with hyperthreading, a wa% of 12.5% might mean that one CPU core is waiting all of the time for the disk — potentially a serious problem impacting server performance — or it could mean that all CPU cores are waiting 1/8th of the time — far less serious.
Because of this, on modern servers, the IOWAIT value doesn’t mean a whole lot on its own. If you see it inching up higher than you’d like, it would be smart to look at other values to determine if there is a real problem or not. In this way, these days, IOWAIT more draws your attention to look for real problems, and doesn’t so much tell you if one exists or not.

In the example image, you can see “0.0 wa”, meaning 0.0% iowait. Certainly even with the caveats mentioned before, this would indicate that iowait is not a problem. But what if this value is higher?
Given the problems with iowait, what should you look at instead? In most versions of linux, the command “iostat” provides a much better idea of the health and performance of your disk system. If you don’t have the “iostat” command available, you’d want to install the “sysstat” package — on Ubuntu, often this is done with the command “apt-get install sysstat” and on Centos, this can be done with “yum install sysstat”.
The exact command that I recommend would be “iostat -mxy 10” — then wait 10 seconds. Each 10 seconds it will provide an average of the disk activity over that 10 second period. “m” flag gives the results in megabytes, “x” gives extended results, and “y” flag omits the first result (which would ordinarily be the average result since the system had booted). “10” means to show results every 10 seconds.

From the above, the most immediately useful value to look at is %util — percentage utilization. This is the percent of the time that the disk is actively servicing requests. If this is consistently very high, say, over 50% most of the time, then yes, you most likely are seeing the server run slowly due to excessive disk access. Even this value can be somewhat misleading on NVMe SSDs which can handle many simultaneous connections, but is definitely a good starting point, and very valid for regular hard drives. If %util is consistently under 30% most of the time, most likely you don’t have a problem with disk i/o. If you’re on the fence, you can also look at r_await and w_await columsn — the average amount of time in milliseconds a read or write disk request is waiting before being serviced — to see if the drive is able to handle requests in a timely manner. A value less than 10ms for SSD or 100ms for hard drives is usually not cause for concern, and lower is better.
I hope this article has given you an idea of whether or not you should be concerned about your servers disk performance as it relates to iowait and util% statistics.
Do you love servers?
If you love servers like we do, we’d love to work together! IOFLOOD.com offers dedicated servers to people like you, and as part of that service, we optimize your OS installation to improve performance and stability. To get started today, click here to view our dedicated servers, or email us at sales[at]ioflood.com to ask for a custom quote.

